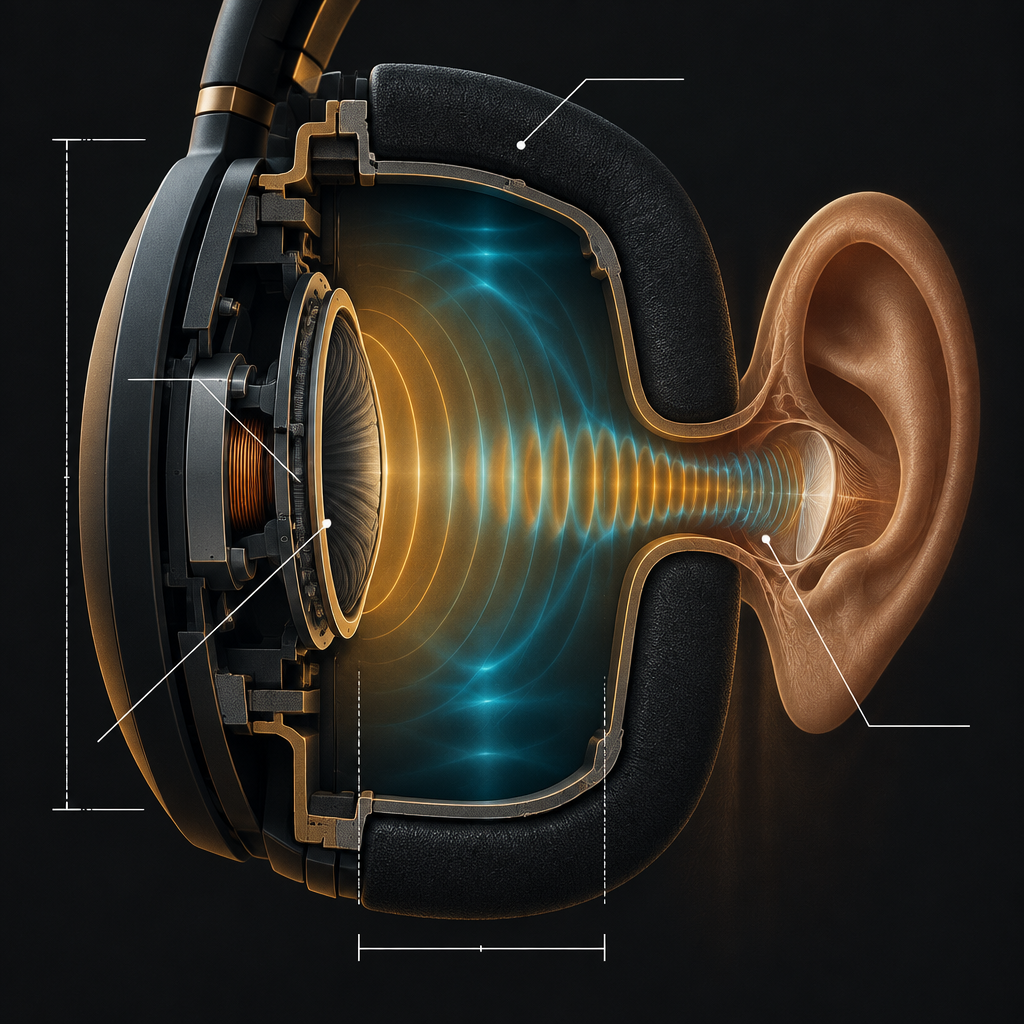
When a headphone manufacturer claims their product is 'tuned to the Harman curve,' they're invoking one of the most rigorous pieces of audio science ever assembled. But what they're really saying is this: we've matched our response to what human ears consistently prefer when listening to music in a controlled environment.
The Harman curve isn't magic. It's empiricism. In 2016, researchers at Harman International (the audio division of Samsung) compiled four decades of listening tests, consumer preference data, and psychoacoustic measurements from thousands of listeners across multiple generations and cultures. What emerged was a target frequency response that, when measured at the ear canal entrance, consistently produces the most satisfying listening experience. The result upended audio philosophy.
The Fallacy of Flat Frequency Response
For the previous 50 years, the industry baseline was flat response. The logic seemed airtight: a microphone creates a voltage proportional to sound pressure, amplifiers preserve that voltage without coloration, and speakers reproduce it faithfully. Ergo, a flat frequency response from 20 Hz to 20 kHz meant perfect fidelity. The entire audiophile tradition was built on this assumption. Measure your headphones with a microphone. Draw the curve. Flatten it.
Then the Harman team asked a simpler question: what do people actually like?
Empirical Audio Testing: Mapping Consumer Preference
Their methodology was elegant. They used trained listeners and untrained listeners. They tested different genres: classical, pop, rock, hip-hop, electronic. They ran preference tests where listeners chose between a reference headphone tuned to the Harman curve and various other headphones with different response shapes. Across all of this, a single pattern emerged with remarkable consistency. The most preferred response wasn't flat. It had distinct peaks.
Presence and Brilliance: Breaking Down the Response Peaks
The first peak sits around 2 kHz. This is the presence peak, and it makes voices and instruments feel more forward, more immediate, more engaging. A 4 dB boost here makes a vocalist jump out of the mix in a way that feels natural, not artificial. Classical instruments gain definition. Drums snap.
The second peak is broader and sits between 4 kHz and 8 kHz. This is the brilliance region. It controls clarity and articulation. Too little and headphones sound dull, veiled, recessed. Too much and they become fatiguing, harsh, like listening through a tin can. The Harman target aims for just enough to convey the micro-details in a recording without inducing listening fatigue over long sessions.
The Psychoacoustics of the Harman Bass Lift
Then there's the bass. Here's where consumer preference diverges most dramatically from studio neutrality. The Harman curve specifies a gentle lift starting around 200 Hz and peaking around 100 Hz, with about a 4 dB boost relative to the midrange. This isn't because bass is 'more musical.' It's because human ears are less sensitive to low frequencies, and the Harman research found that listeners consistently preferred headphones with this bass boost when comparing them to genuinely flat-response models.
Consumer Tuning Versus Studio Neutrality
This creates an immediate problem for studio professionals: the Harman curve is tuned for listening pleasure, not production accuracy. A mixing engineer working in a mastering suite doesn't want the Harman curve. They want flat response so they can hear exactly what they're creating without the coloration of consumer preferences warping their judgment. A critical difference emerged: consumer headphones should target Harman. Studio monitors should target flat or house curve standards like the one defined by AES.
The Measurement Dilemma: Dummy Heads and Coupler Artifacts
But here's where it gets complicated. Measuring frequency response isn't as straightforward as manufacturers imply.
When Harman researchers measure headphones, they use a KEMAR artificial head, a torso, realistic pinnae, and an ear canal simulator that mimics the acoustic properties of a real human ear. They're not measuring at the headphone driver. They're measuring what actually reaches the eardrum of an average listener, accounting for the resonance of the ear canal (which adds a peak around 3 kHz naturally), the diffraction of sound around the head, and the acoustic impedance matching between air and the inner ear.
Most consumers never see this data. What they get is frequency response measured at the headphone coupler, a standardized acoustic cavity that bears almost no resemblance to a human ear. Two headphones can measure completely different on a headphone coupler but sound nearly identical because the coupler doesn't account for ear canal resonance, head-related transfer functions, or the complex acoustics of how sound actually reaches the cochlea.
This is why a headphone that measures flat on a generic coupler might sound thin and presence-lacking when you put it on. Your ear canal adds resonance that a coupler never will.
The real insight of the Harman research is this: our ears don't want flat. They want a response that sounds natural to the ear canal of a typical human. This is why even the most expensive, scientifically designed consumer headphones (Harman Kardon, JBL, Samsung Galaxy Buds Pro) now target the Harman curve. It works. Year after year of preference testing validates it.
Real-World Headphones and Commercial Tuning
Manufacturers sometimes claim to offer 'multiple EQ presets,' giving consumers choices between 'bass boost,' 'treble enhancement,' and 'neutral.' What they're really offering is variation around the Harman target. The 'neutral' preset is usually the Harman curve. The 'bass boost' is an even larger peak around 100 Hz. The 'treble' lifts the presence region further.
Sony's WH-1000XM5, consistently rated among the best-sounding consumer headphones, measures within 2 dB of the Harman target across most of the spectrum. Bose's Noise Cancelling Headphones 700 follows a similar approach. These aren't accidents. They're engineering choices based on 40 years of listening data.
For the consumer, this means something important: when you buy a well-tuned headphone from a reputable manufacturer, you're not getting a random design choice. You're getting the culmination of thousands of listening tests proving that your ear will prefer it. The Harman curve isn't law. Individual preference varies. Some people prefer extra bass. Some prefer a more recessed midrange. But the Harman research identified the statistical center of human preference, and that center is remarkably consistent across age, culture, and music taste.
The next time you read that a headphone is tuned to the Harman curve, you'll know what that really means: someone measured what makes human ears happy, and this headphone matches that target. It's not a marketing claim. It's the voice of thousands of listeners, encoded into a frequency curve.